My role as a BI Analyst began with revamping management reporting by designing and implementing a new suite of interactive dashboards in Tableau, leveraging disparate data sources (internal SQL databases, Google Analytics, Excel) to provide a seamless and dynamic view of the business with robust dimensionality. This included educating and training 20+ business users on what is available in Tableau reporting, how to use the self-service environment, and how it can help them do their jobs more effectively.
I now work primarily with marketing management to provide insights, develop new iterations of dynamic dashboards, and assist in planning endeavors and strategic objectives. This includes optimizing to key performance indicators across a diverse landscape of online and offline media channels (i.e. Social, SEO, SEM, Display, TV, Radio, VOD, etc.), uncovering opportunities to acquire market share using sentiment and competitor sales data, and providing analysis in support of web A/B split testing.
I’m known around the office as both optimistic and results-driven, leading to my appointment as the BI team Scrum Master. In this additional role, I facilitate daily team scrum meetings and bi-weekly sprint ceremonies to cultivate agile development and team productivity.
Below are some examples of dashboards I have created. Data has been altered and blurred out to protect company privacy.
Survey visualization, combining attributes with customer sentiment
Interactive daily pulse dashboard
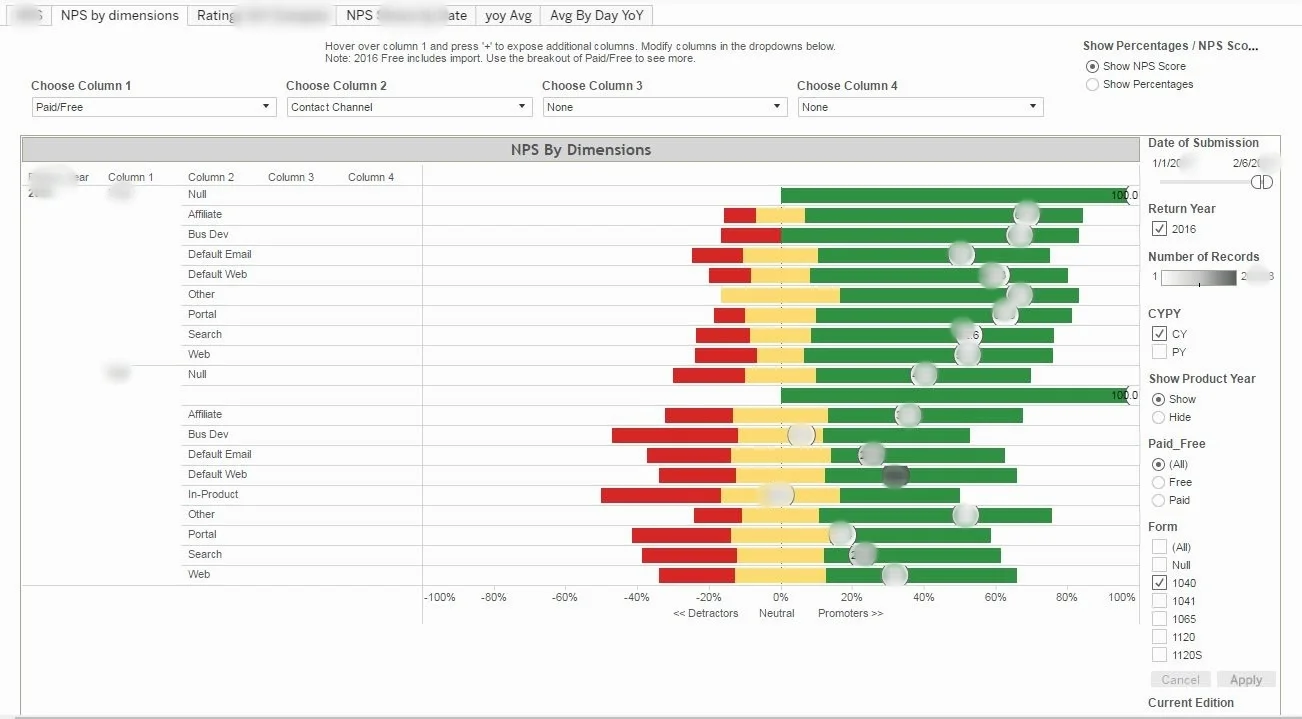
NPS (Net Promoter Score) visualized and shown by user-modified dimensions


